Interpretation tutorial
In the following tutorial , we would introduce you the way the TSProto should be interpreted. This tutorial does now include any code examples, as it solely focuses on the analysis of the plots produces by the TSProto. Several examples would be given to show the performance of the method on versatile data.
Basic interpretation of TSProto
TSProto allows you to interpret the decision of a blackbox machine learning model by constructing a decision tree, which nodes are formed not from single values as usually, but from chunks of data, representing slices of time-series that are relevant in some way to the blackbox model.
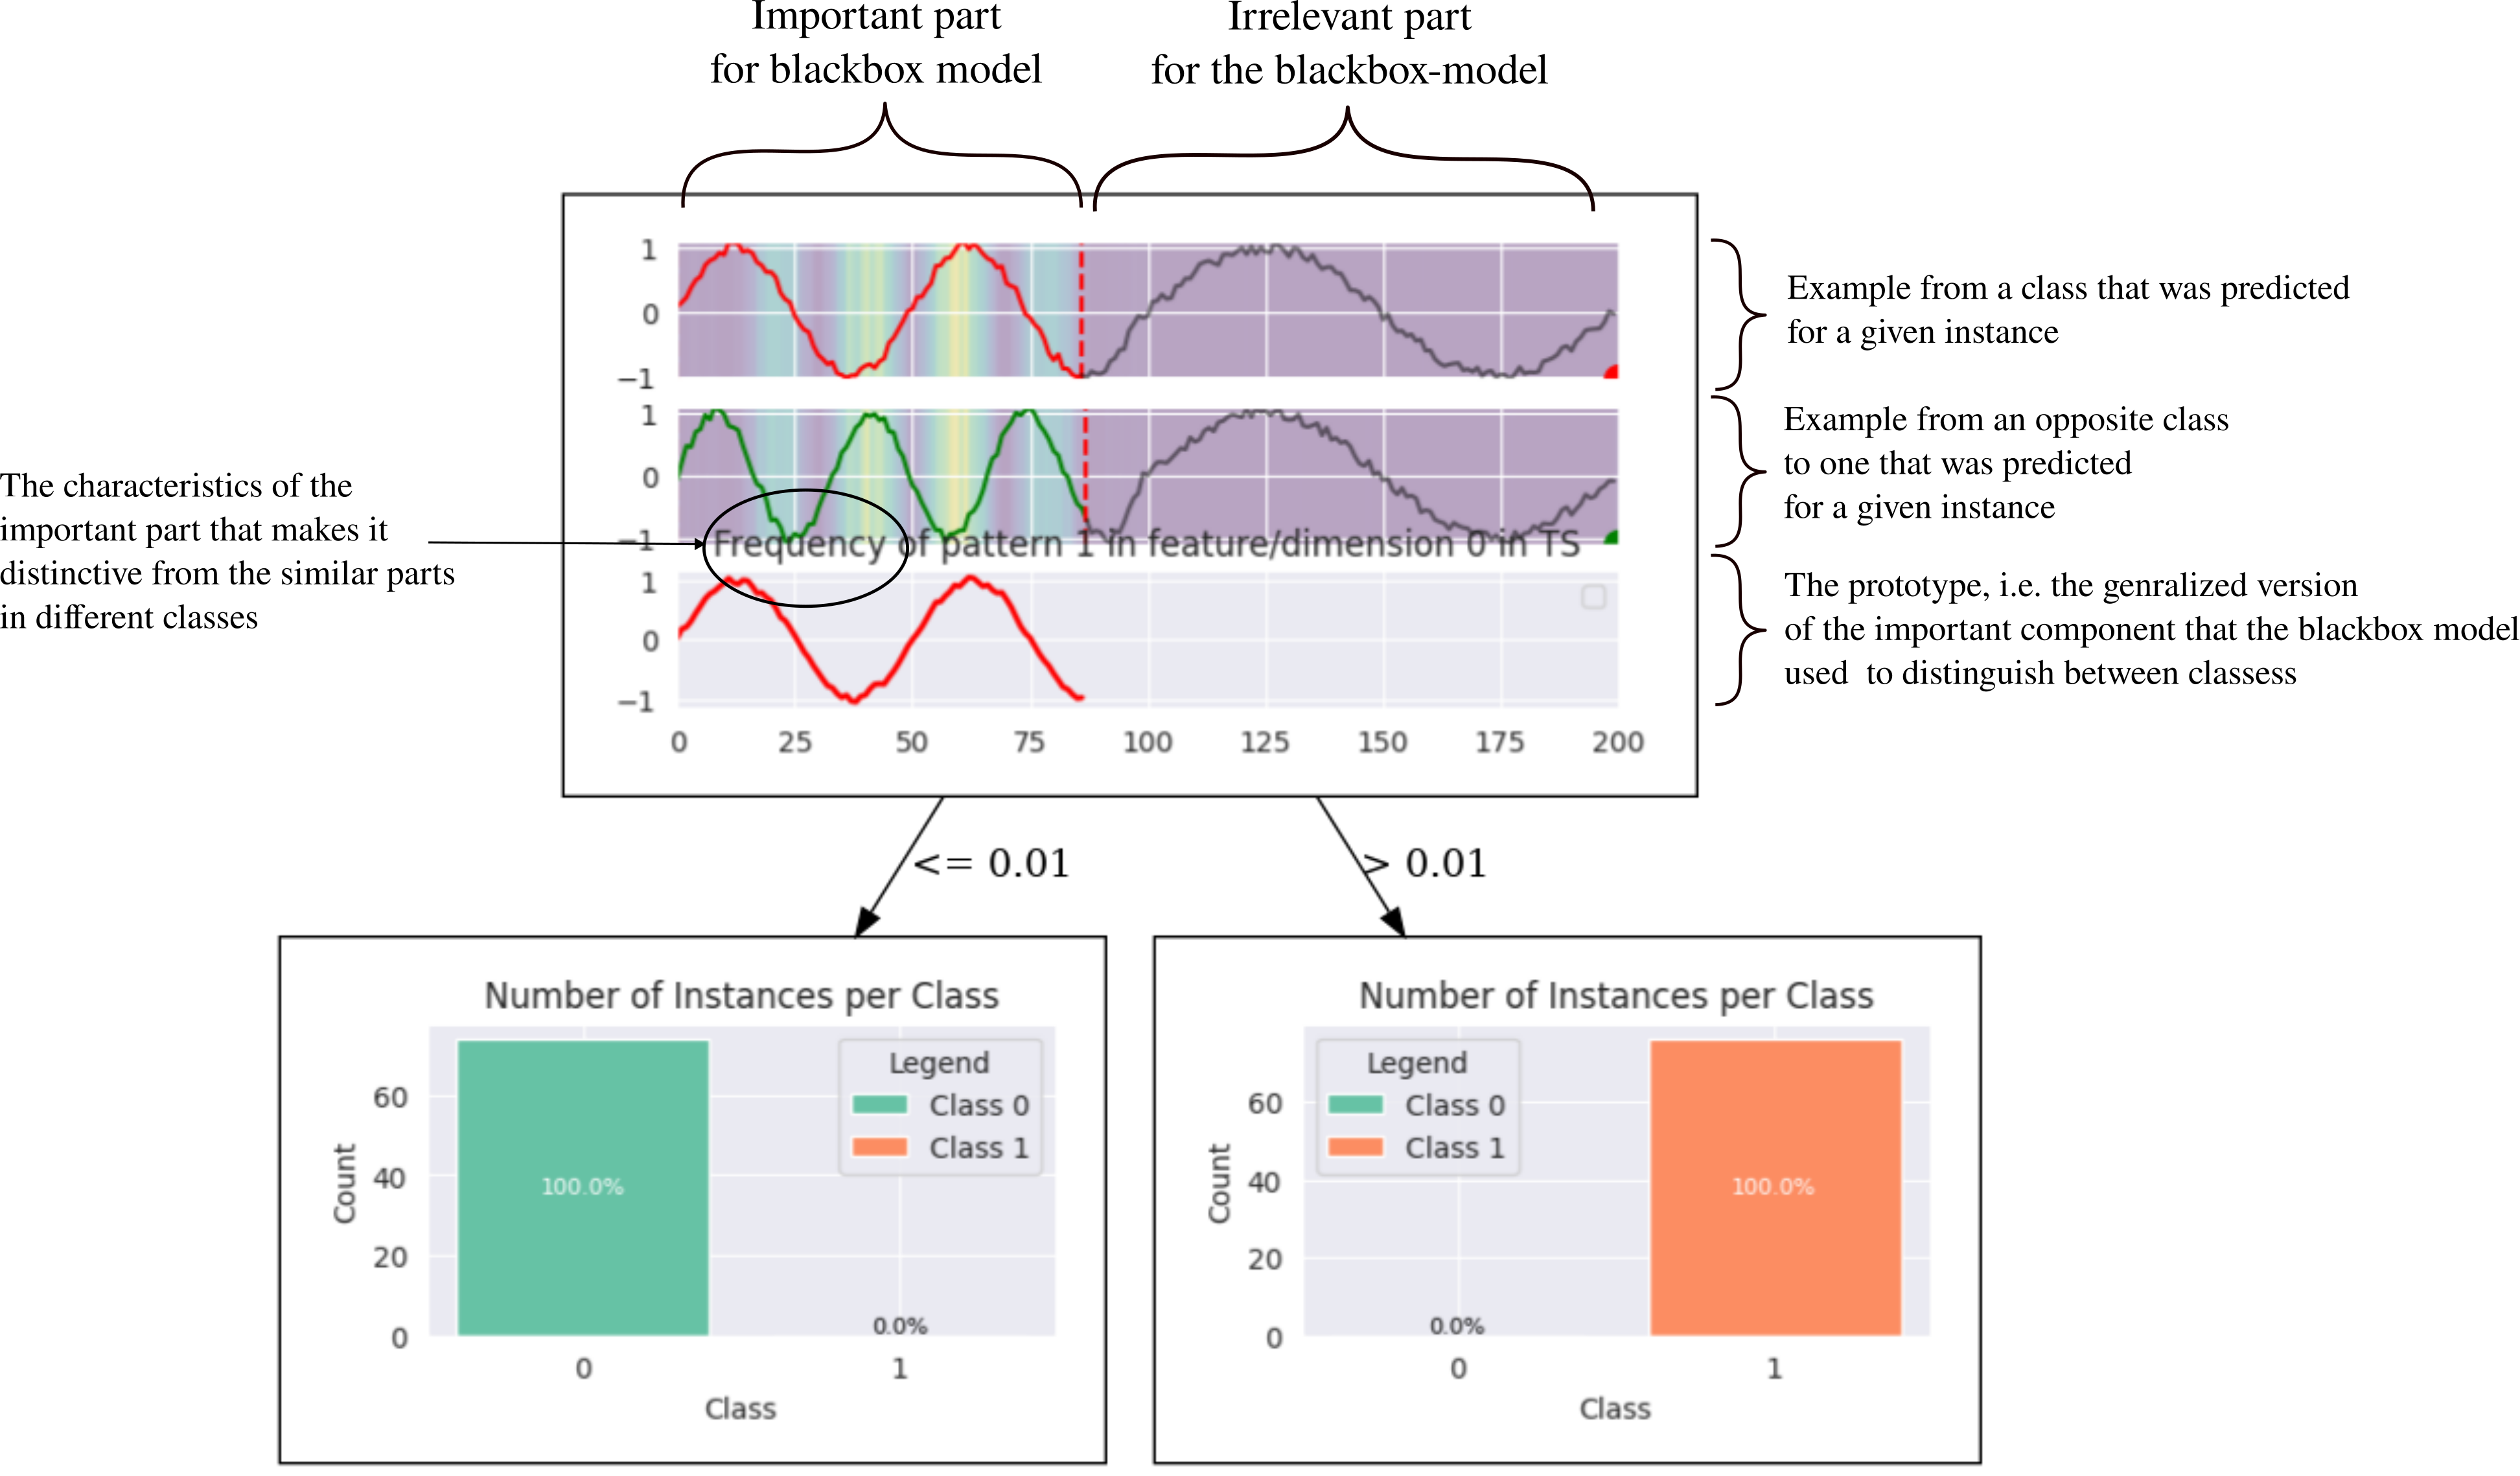
The following example shows the case, where there are two classes which can be differentiated by the component of different frequency. The example below shows an explanation of the black model that was trained to distinguish between two classes of time series, which was different only in the first part of the series with different frequency.
The explanation below should be read as follows: If the stime series contains a component of a frequency that is greater than 0.01 Hz than it belongs to class 1, otherwise, class 0.
Contrastive examples in healthcare data
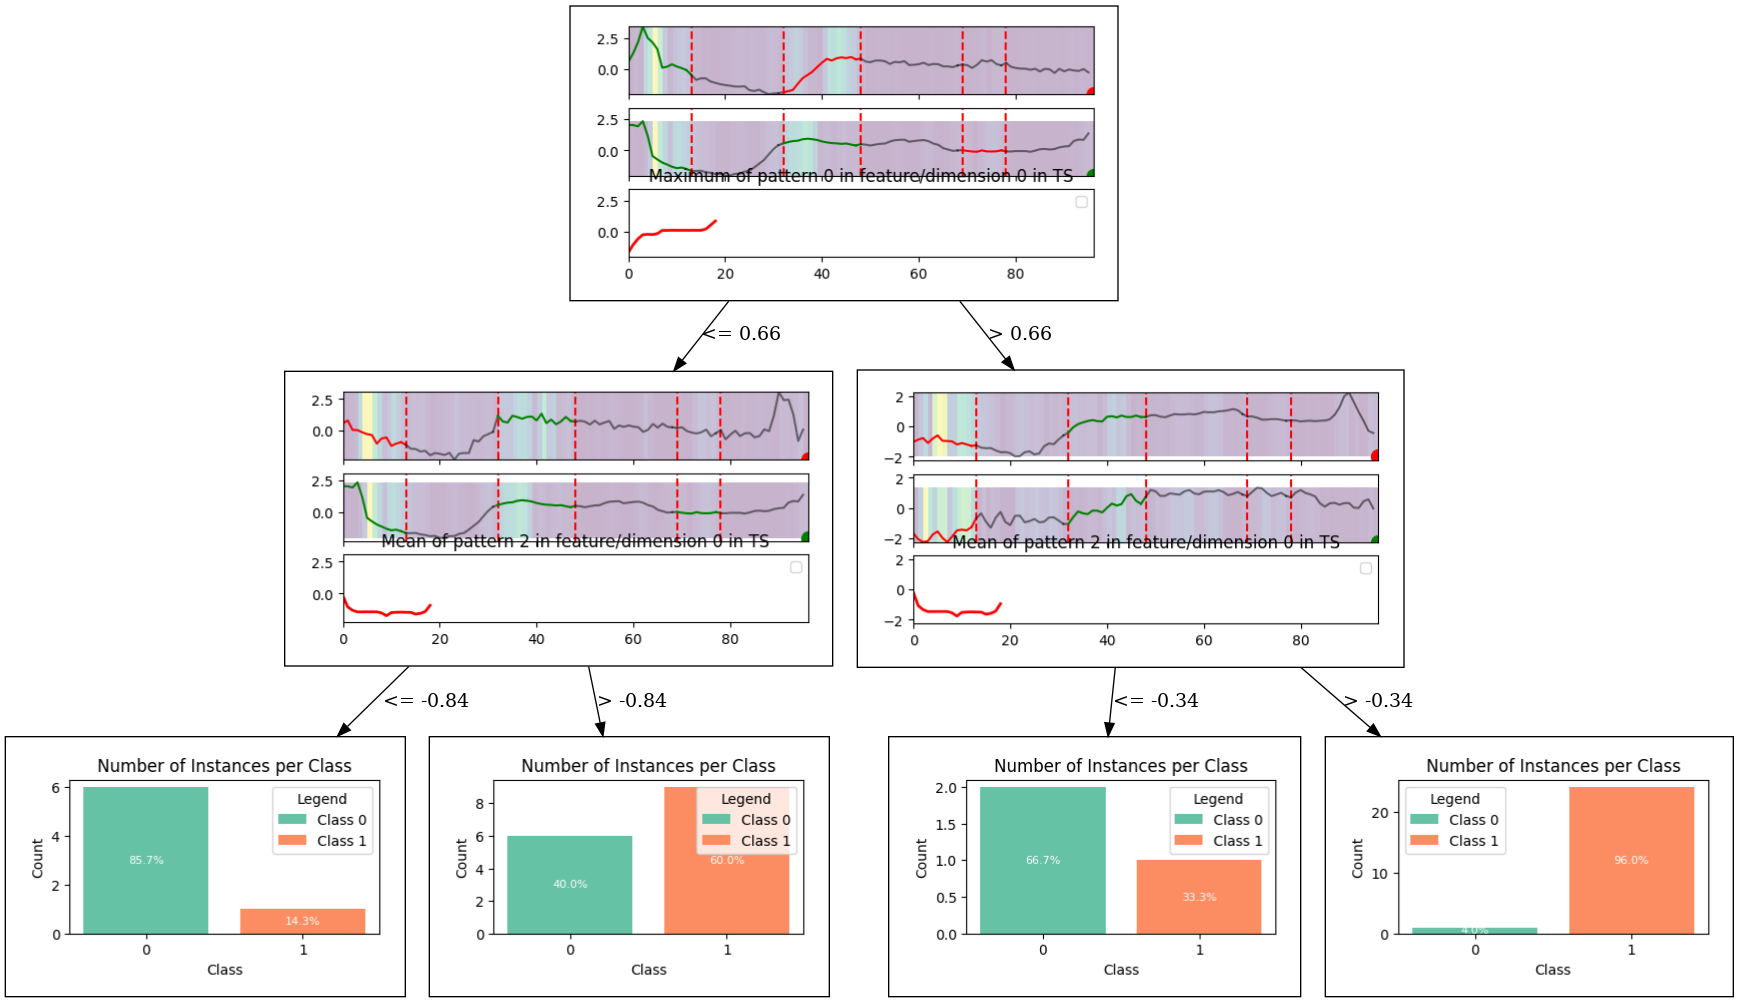
The next example shows the ECG200 dataset form UCR repository The dataset distinguishes between healthy and unhealthy patients.
In the figure below you can see how the TSProto interpreted the blackbox model decisions. In this example, the TSProto was asked to compare fragments of time-series only at matching locations (i.e. do not compare fragment form the end of ECG with fragment form the beginning, as the location of the patter in this time series maters).
The middle plot contains therefore the contrastive fragment of samples from opposite class than the top plot. This contrastive samples show how the particular fragment of the plot should look like in order the class to be changes by the blackbox model.
Anomaly interpretation in Industry 4.0
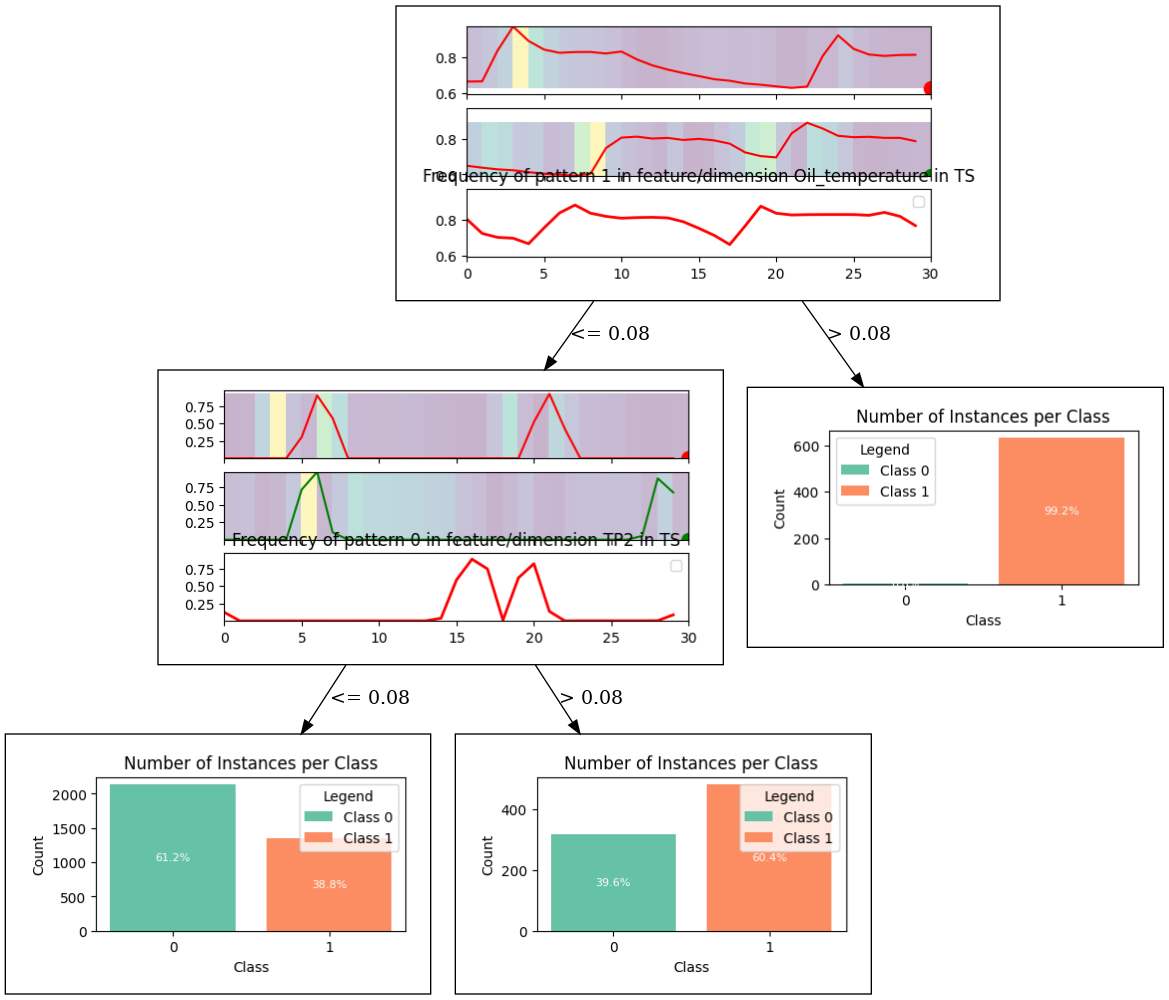
Finally the last example shows the explanations for anomaly detection in MetrPT dataset The balckbox model was trained to detect failures in air compressor unit ofd the trains of Metro de Porto.
The explanation was generated for the third failre that was caused by the oil leak in the unit. It can be seen that in this case, the TSProto used whole time-slice as a explanation component, because the black-box model was already trained on the time-slice that has a minimal length, and should not be sliced into smaller parts.
The first plot in each node correspond to the anomalous time-slice, the middle to the contrastive example (i.e. the normal sample) and the third plot correspond to the prototype, i.e. the representative example of the time-awriwa that correspond to the anomalous case.